Assisted Attribution
Assisted Attribution
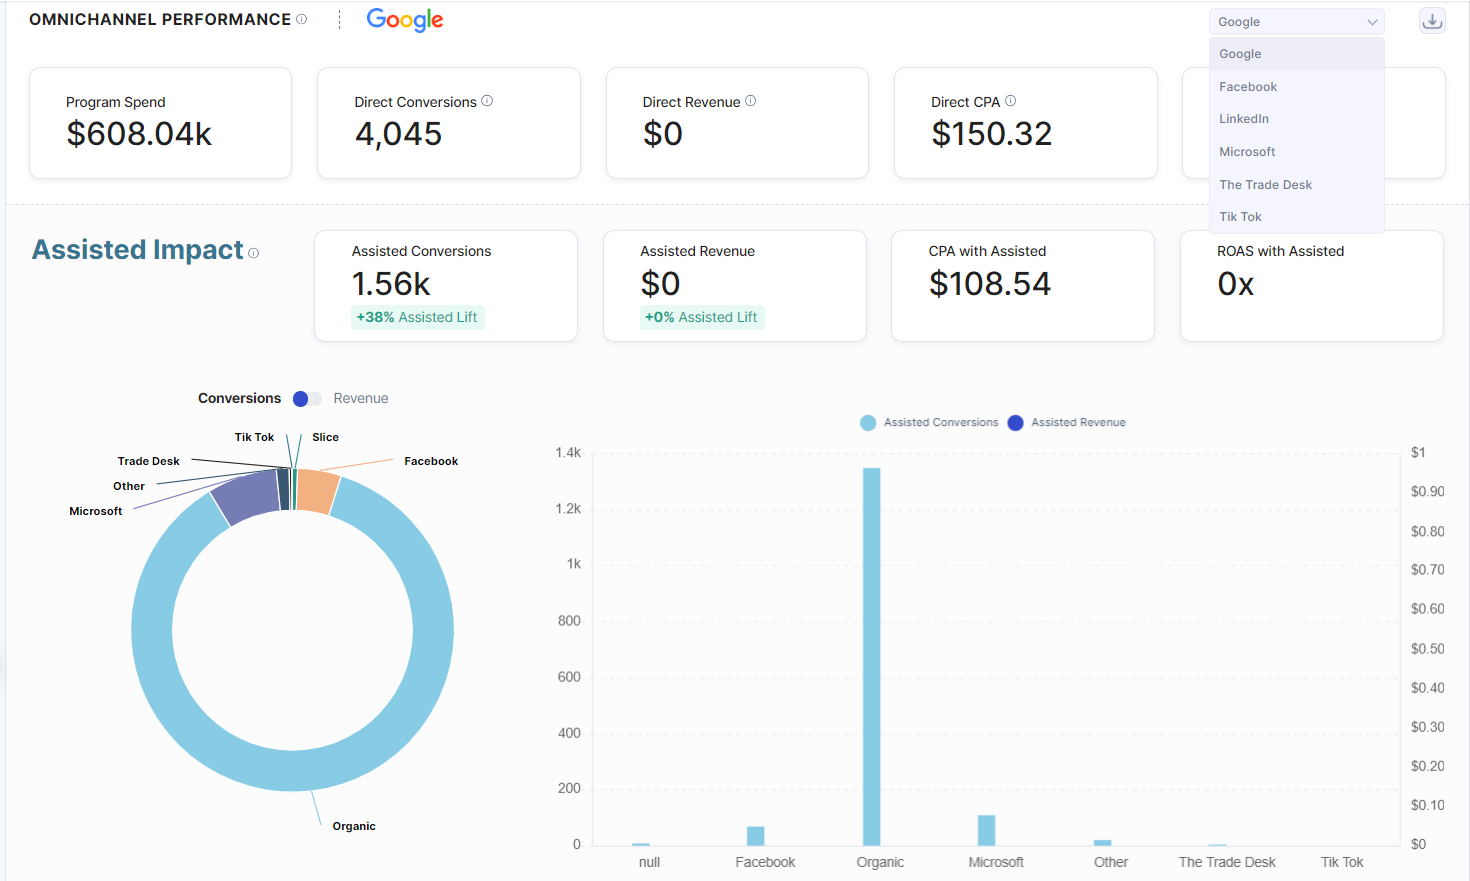
Assisted Impact attributes conversions or revenue to a network based on all the user's touchpoints, not just direct based on the attribution model selected.
Assisted numbers are not necessarily additional conversions or revenue, but can be used directionally in order to determine which networks are providing the most value as part of an omnichannel strategy. It's important to keep in mind these conversions and revenue may have already been attributed to another network in your attribution reports.
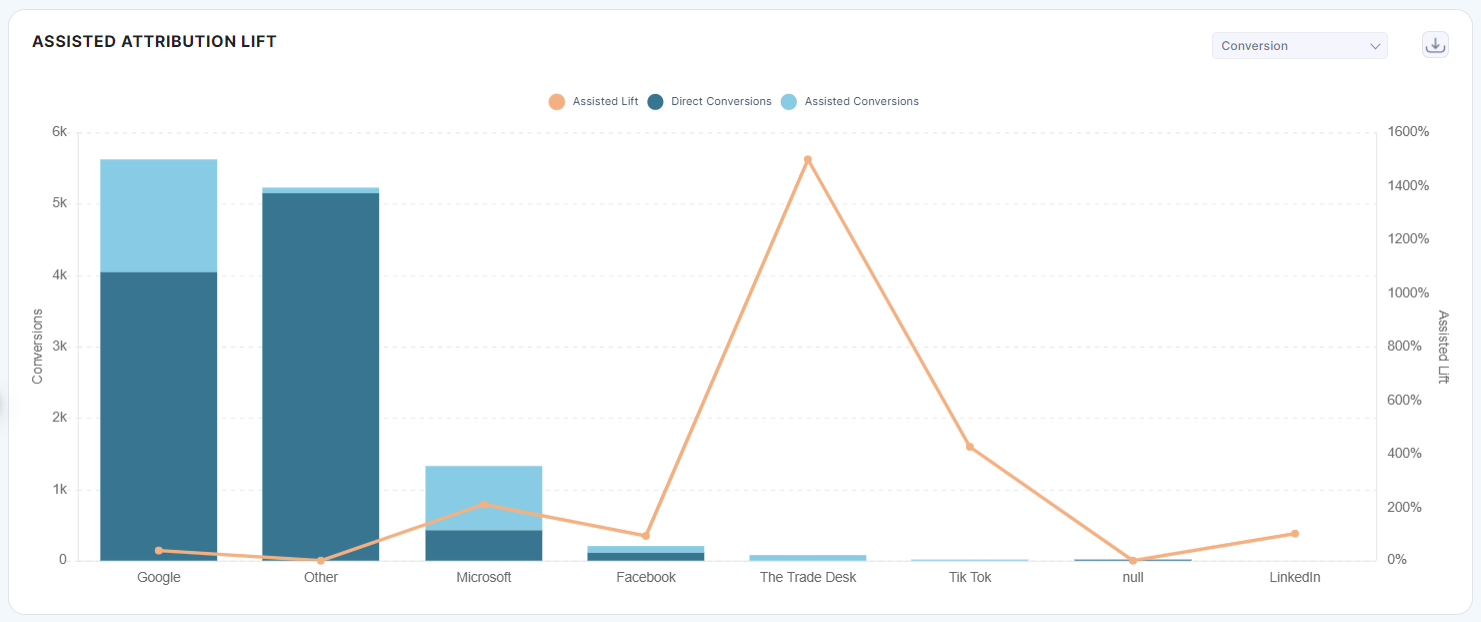
Assisted Attribution Lift
The assisted attribution lift chart illustrates conversions across channel that were generated by network directly or came in via an assist. When hovering over the components within the chart, a detailed breakout displays the direct and assisted impact per network.
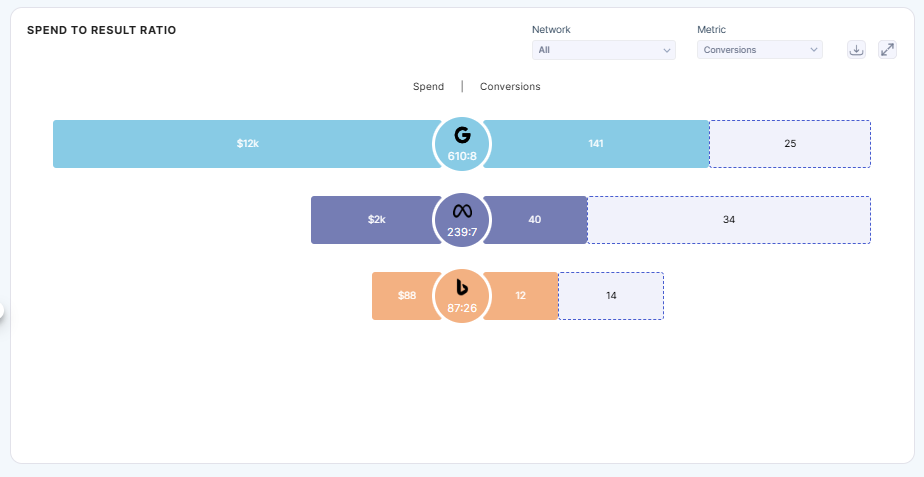
Spend to Result Ratio
The spend to result ratio graphic compares spend to a metric of your choice for all networks you are advertising on. It helps identify which networks are giving you the best return on either conversions or revenue for your spend. When hovering over each network, you can view direct and assisted conversions, direct and assisted revenue, program spend, and assisted lift.
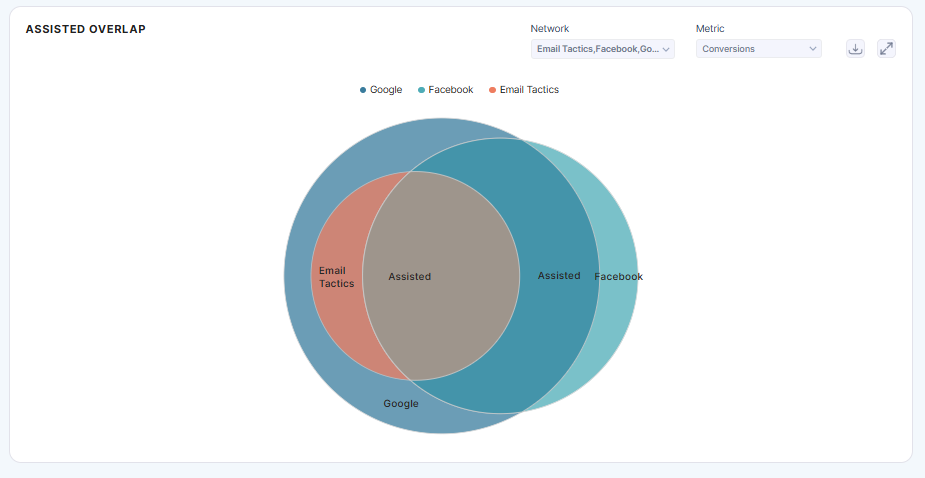
Assisted Impact Overlap
The assisted impact overlap graphic is a venn diagram displaying tactics and networks, allowing you to see how a metric of your choice overlaps between them. It lets you see how conversions or revenue are attributed, whether it was direct from a network, a tactic, or assisted by one or the other. We advise against selecting every network as the graphic can become hard to interpret.