Brand vs. Generic
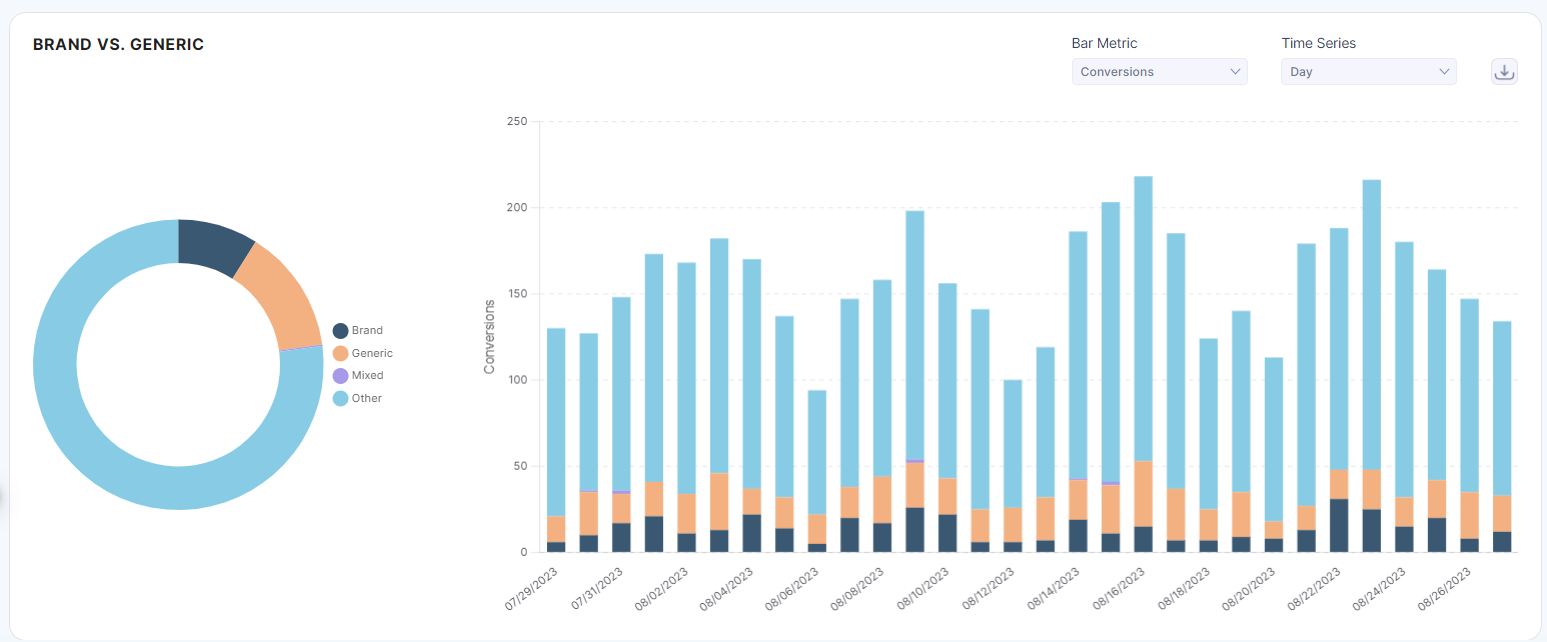
The Brand vs. Generic donut and bar chart combo allows a user to understand total performance by brand vs generic keywords and what that performance looks like over time. Based on the global filters and local filters set in this component, the bar chart displays the performance of conversions and revenue by Brand, Generic, Mixed, or Other keywords over time, while the donut chart represents the ratios. When hovering-over the bar and donut charts, the detailed conversions or revenue are provided.
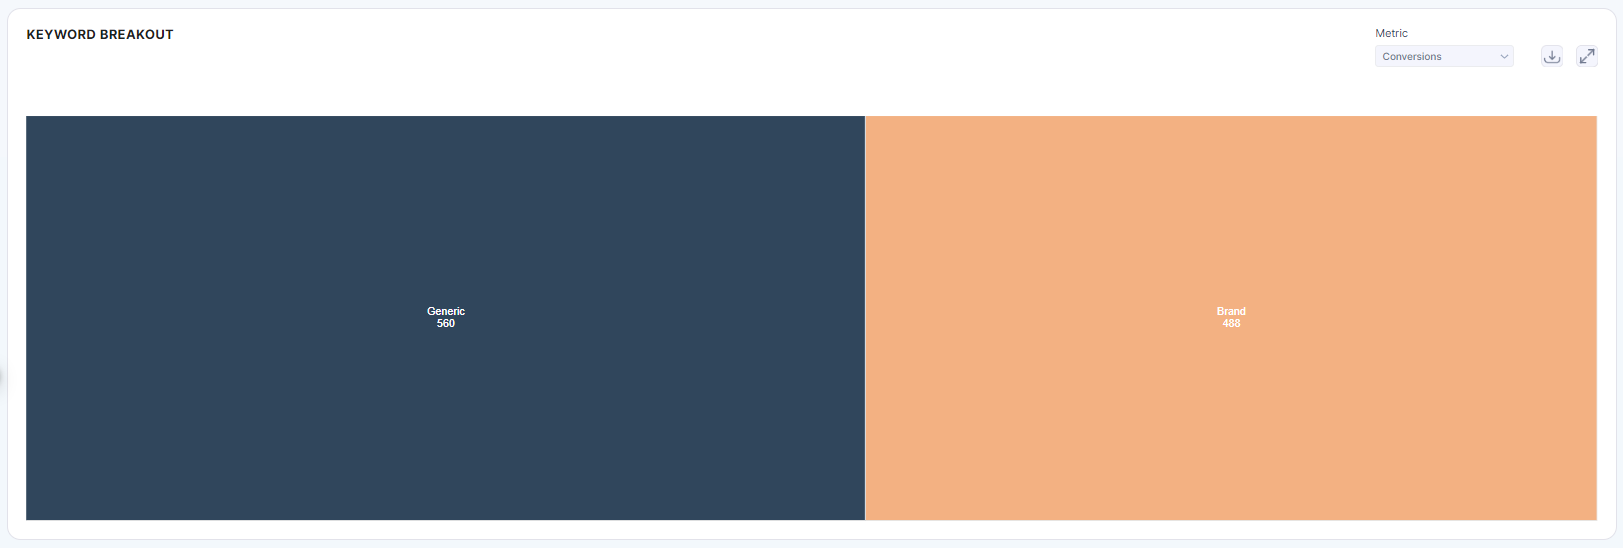
The Keyword Breakout chart lets the user drill into top performing brand or generic keywords. By default, the visual appears showing the performance of brand vs. generic keywords proportionally. The user can then click on the Brand or Generic cells to drill further into performance. Doing this then changes the visual, showing all of the brand or generic keywords and their respective performance depending on which keyword the user clicks.