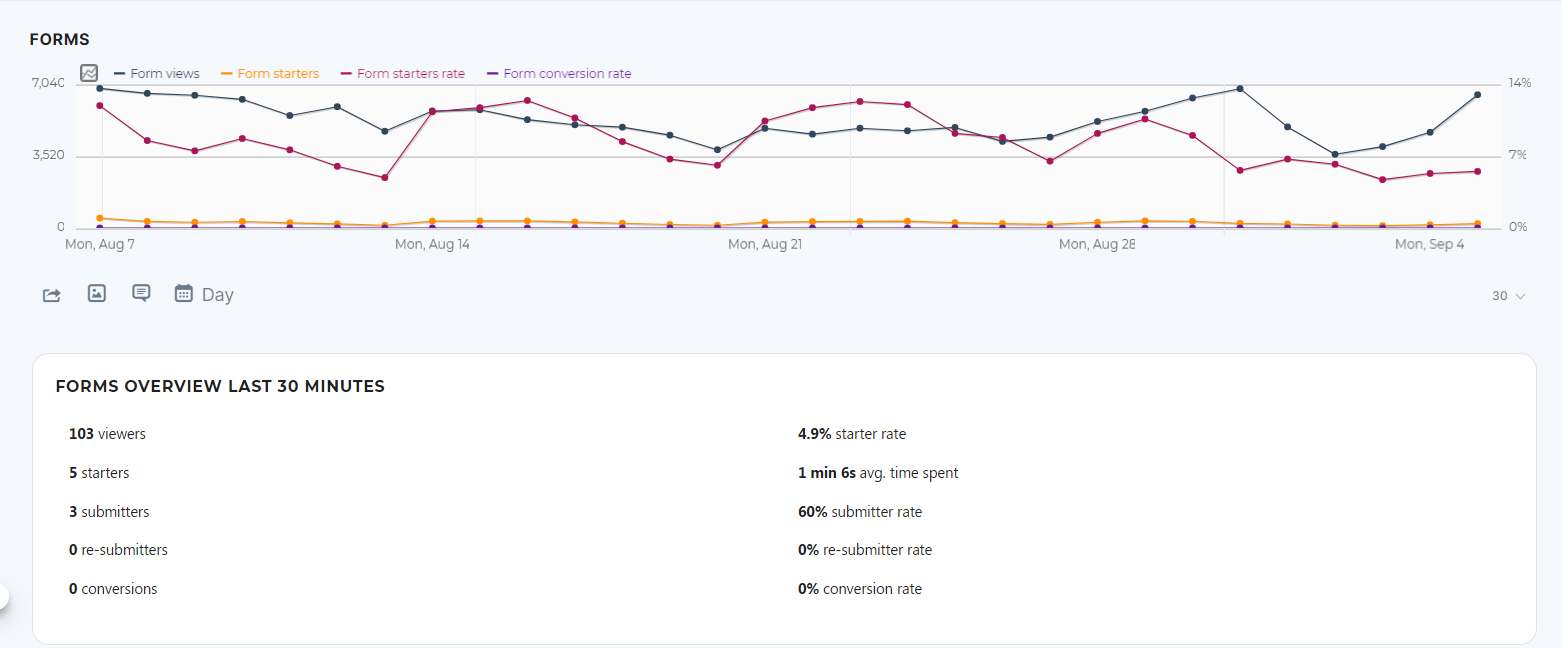
Form Activity
The bar chart represents the % of users that started to fill out a form vs. the % of users that completed a form over time. A snippet also shows form related information over the last 30 minutes which includes the count of visitors that viewed the form, started to fill out the form, completed the form, etc.