Touches & Days
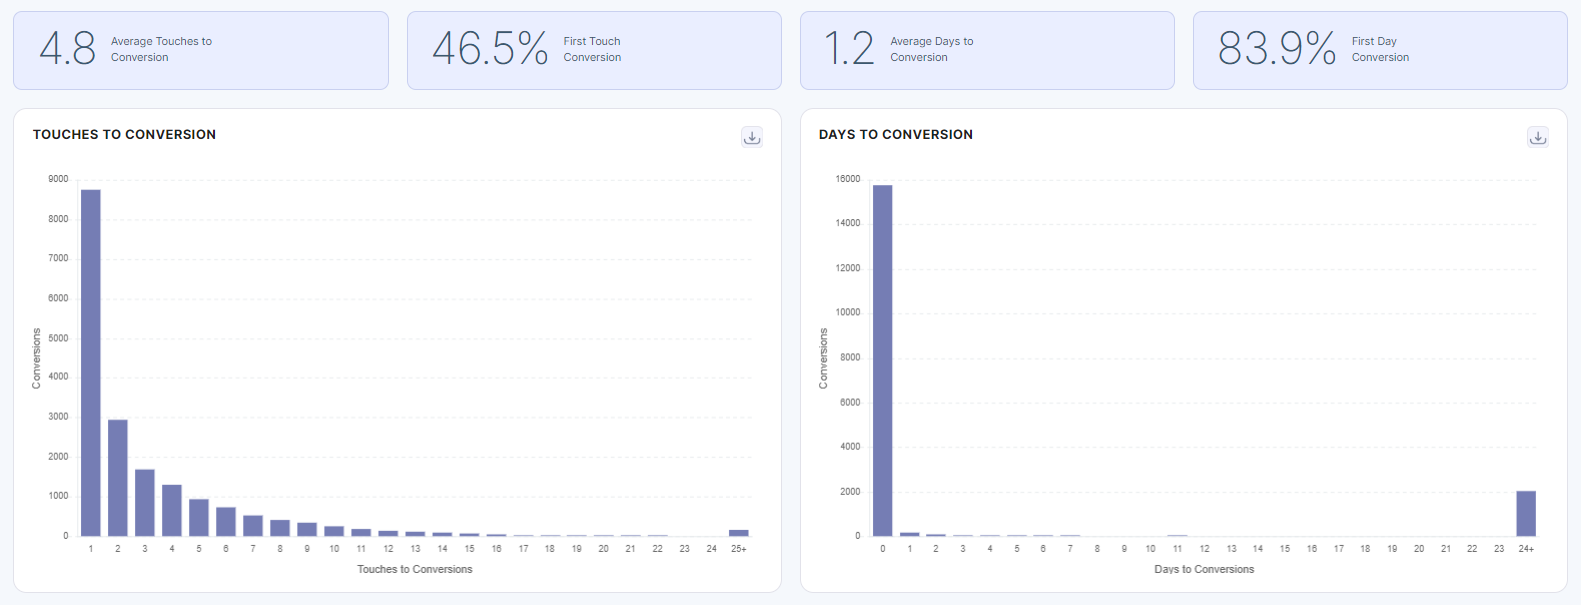
How long does it take for a user to make a purchase? How many times do we need to engage with that user to push them down the conversion funnel? This is a question every marketer asks themselves. Our Touches and Days report aims to help marketers find the correct mix of upper funnel and lower funnel tactics without sacrificing volume.
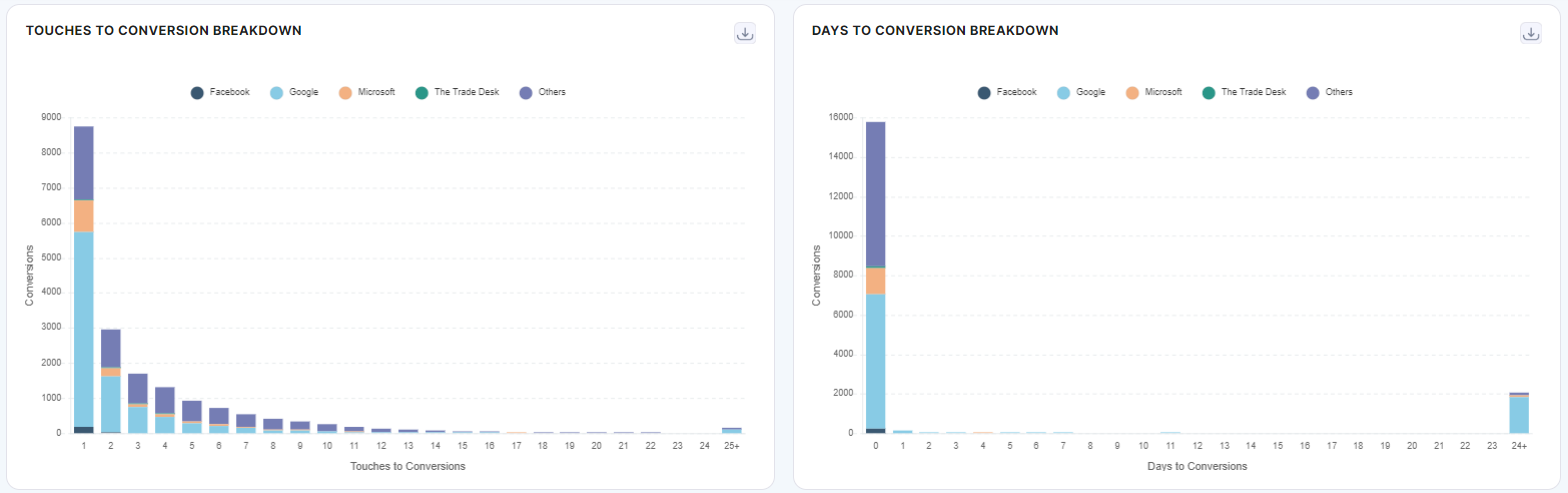
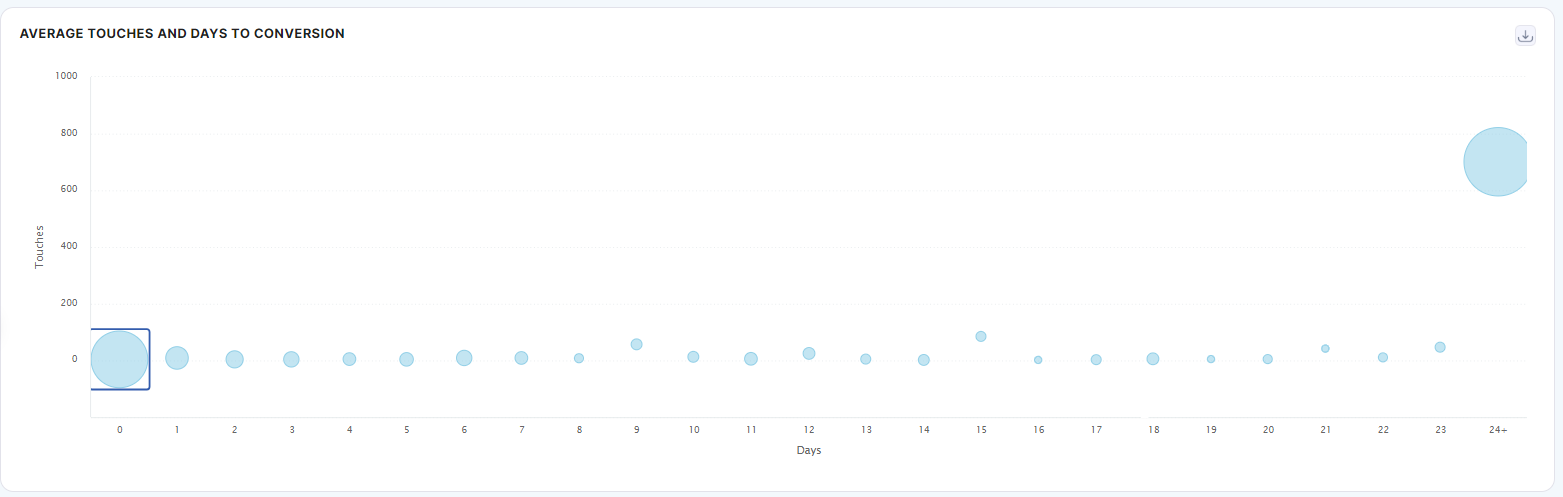
Within this page, the user can see histogram distributions and breakdowns of touches to conversion and days to conversion. The bubble graph shows the average touches per day, average conversions per day, and the relative number of interactions in size comparison to the other combinations. The bubble gets larger in size as the number of conversions increase.